Project Overview
InSARLite is a comprehensive Graphical User Interface (GUI) application designed to simplify and streamline Interferometric Synthetic Aperture Radar (InSAR) processing using the GMTSAR workflow. This page provides an overview of InSAR fundamentals, InSARLite’s architecture, and the complete processing workflow.
What is InSAR?
Interferometric Synthetic Aperture Radar Basics
Interferometric Synthetic Aperture Radar (InSAR) is a remote sensing technique that uses radar satellites to measure ground deformation and create digital elevation models. By comparing the phase information between two or more radar images of the same area taken at different times, InSAR can detect surface changes as small as a few millimeters.
Key InSAR Concepts
Interferogram: The phase difference between two SAR images, revealing surface deformation patterns.
Baseline: The spatial and temporal separation between satellite acquisitions:
Temporal Baseline: Time difference between acquisitions
Perpendicular Baseline: Spatial separation perpendicular to the satellite track
Coherence: A measure of phase stability between two SAR images, indicating the quality of interferometric information.
Phase Unwrapping: The process of converting wrapped phase values (-π to π) into continuous displacement measurements.
Applications of InSAR
InSAR is widely used for:
Earthquake Monitoring: Measuring co-seismic and post-seismic deformation
Volcano Studies: Monitoring volcanic uplift and subsidence
Urban Subsidence: Tracking land subsidence in cities
Landslide Detection: Identifying and monitoring slope instability
Glacier Monitoring: Measuring ice sheet dynamics
Infrastructure Monitoring: Tracking deformation of buildings and bridges
InSARLite Architecture
Design Philosophy
InSARLite is built on the principle of accessibility without compromising capability. We have developed and tested InSARLite in Linux environments (Ubuntu 20.04 and 22.04) and released it as an open-source package via GitHub and PyPI.
It primarily uses the Python subprocess module to orchestrate GMTSAR command-line programs and shell scripts for various processing steps, while replacing selected GMTSAR shell-script components with Python implementations to enhance efficiency and flexibility. For example, the application of Generic Atmospheric Correction Online Service (GACOS) corrections to unwrapped interferograms builds on the GMTSAR user-contributed shell script.
For enhanced performance, we implemented parallel processing using a Python thread pool for several steps that involve repeated execution of similar operations, including GACOS atmospheric correction, interferogram generation, and phase unwrapping. This allows independent jobs to be dispatched concurrently, reducing total processing time for large stacks while preserving the underlying GMTSAR workflow.
Note
Platform Compatibility: InSARLite has been developed and tested exclusively on Ubuntu 20.04 and 22.04. Other operating systems have not been tested and are not officially supported.
Note
NASA Earthdata Credentials: InSARLite requires NASA Earthdata credentials to authenticate access to Alaska Satellite Facility (ASF) datasets. These credentials are requested only once and stored locally for automated retrieval in subsequent executions.
Conceptual Structure
The conceptual structure of InSARLite is organized around four main processing steps that follow project configuration:
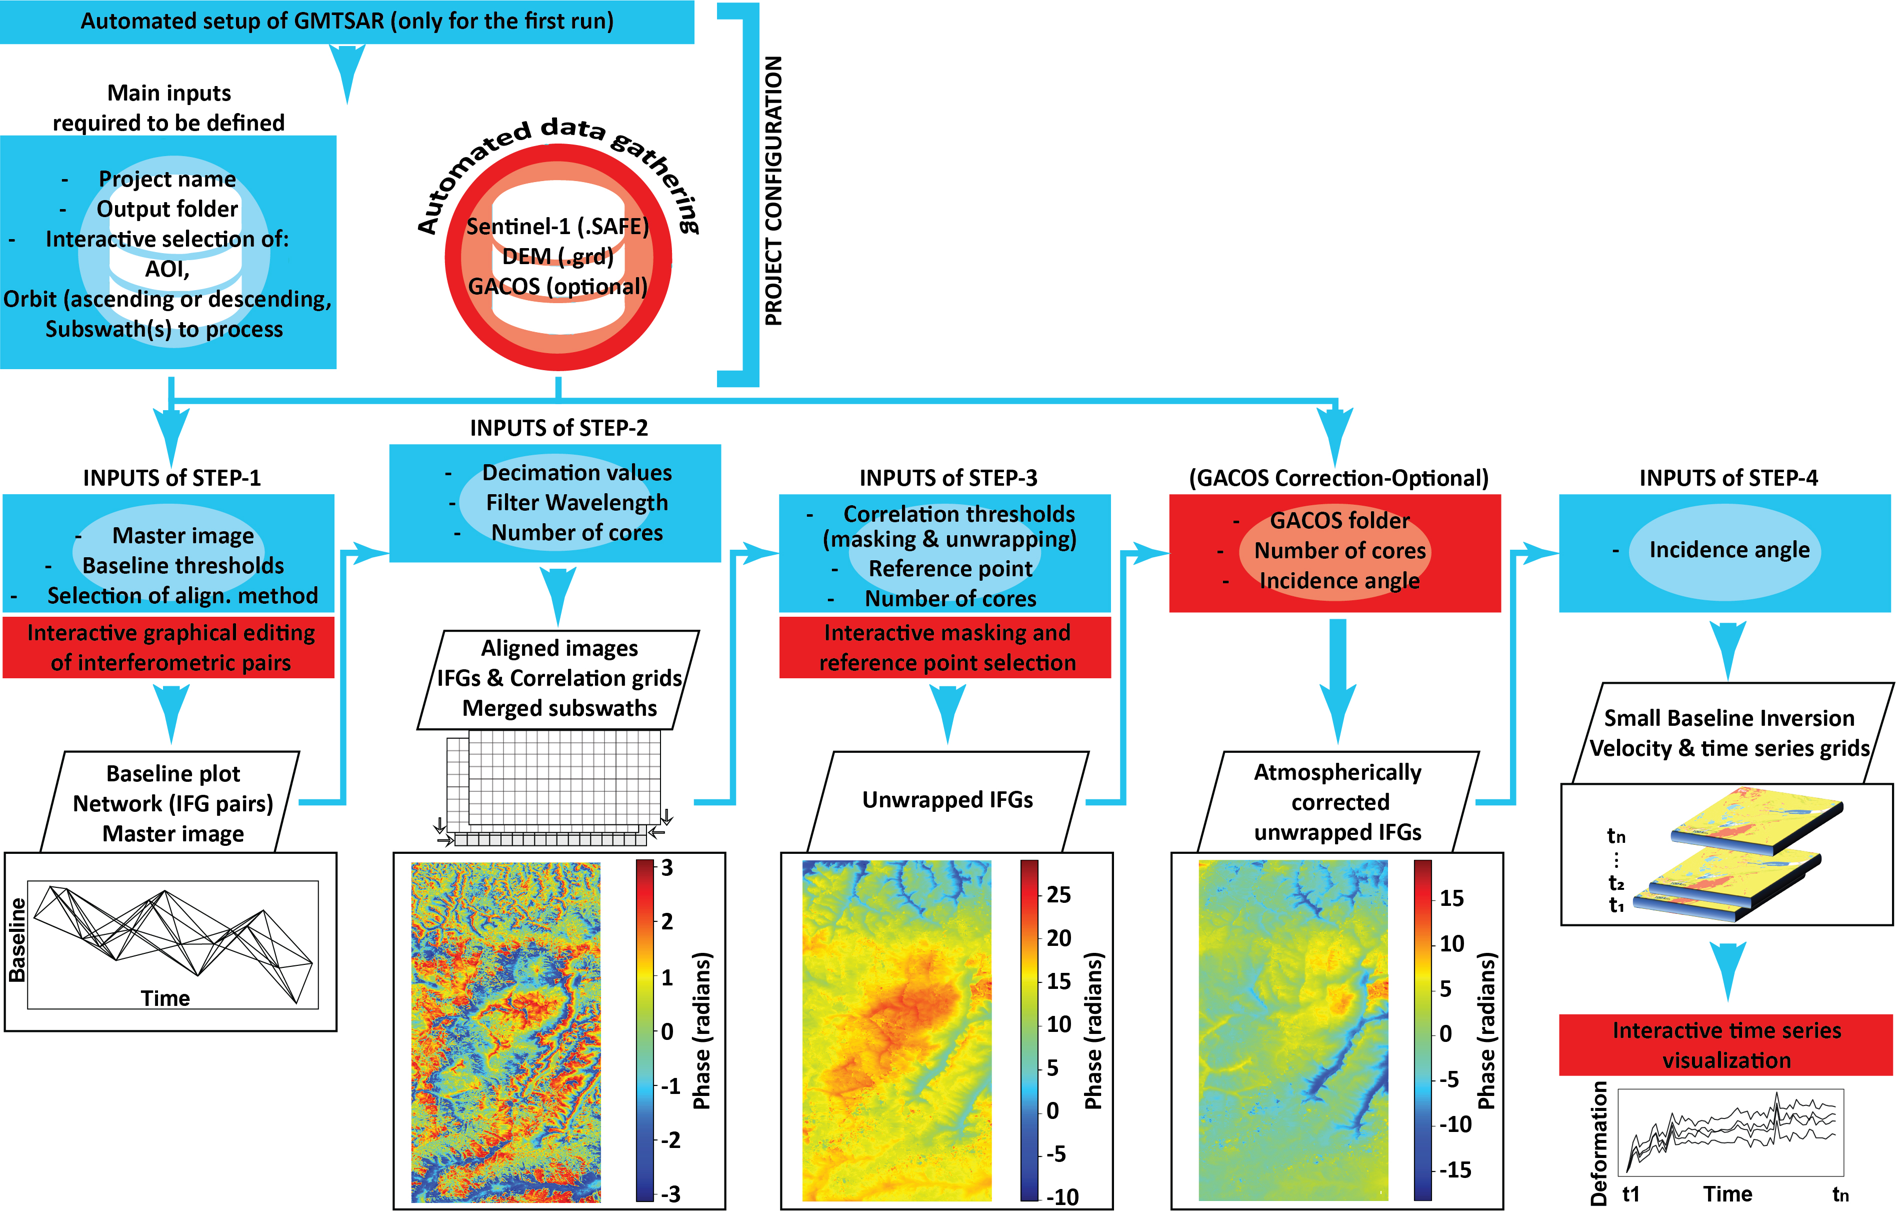
The conceptual architecture illustrates four sequential processing steps following project configuration. Project configuration enables users to define input dataset paths (or download/extract data automatically), specify temporal and spatial parameters, select subswath(s) and SAR polarization, and set orbit direction—establishing the foundation for streamlined InSAR time-series analysis. Red-highlighted operations represent newly implemented functionalities within the traditional GMTSAR workflow, while blue-highlighted modifications support automation and transition from command-line to interactive graphical interface.
Project Configuration
The project configuration step enables users to:
Define paths to input datasets or download/extract data automatically
Specify temporal period and spatial extent
Select subswath(s), SAR polarization, and orbit direction
Set up DEM (Digital Elevation Model) requirements
Configure output directories and project naming
This foundation supports streamlined and automated InSAR time-series processing.
Step 1: Baseline Network Selection (Base2Net)
Calculate temporal and perpendicular baselines for all image pairs
Visualize baseline-time relationships interactively
Select optimal master (reference) image
Define interferometric pairs based on baseline thresholds
Export network configuration for processing
Step 2: Alignment and Interferogram Generation
Align secondary images to master reference
Generate interferograms for selected pairs
Merge multiple subswaths (if applicable)
Calculate mean correlation grids
Apply filtering and quality assessment
Step 3: Phase Unwrapping
Define processing mask (correlation threshold and/or manual delineation)
Select reference point for phase normalization
Unwrap interferogram phase
Optionally apply atmospheric corrections (GACOS)
Validate unwrapping quality
Step 4: SBAS Inversion and Time Series
Perform Small Baseline Subset (SBAS) inversion
Generate deformation time series
Calculate mean velocity maps
Apply optional spatio-temporal filtering
Visualize and export results
Note
Newly Implemented Features: Operations highlighted in red in Figure 2 represent newly implemented functionalities within the traditional GMTSAR workflow, including automated data download, interactive baseline planning, parallel processing, and integrated visualization tools.
Note
Automation Enhancements: Operations highlighted in blue in Figure 2 represent modifications that support automation and the transition from command-line interface to user-friendly interactive interface, such as GUI-based parameter selection, progress monitoring, and one-click execution of complex workflows.
Processing Workflow
InSARLite implements a sequential workflow where controls relevant to the current stage remain active, while other controls are inactive or hidden, guiding users through the InSAR time-series analysis process.
Note
Button Color Coding: Button controls are color-coded to indicate status:
Default appearance: Missing execution or parameter definition
Green: Ready for the corresponding action
Orange: Action has been partially completed
Red: Optional step has been intentionally skipped
Complete Processing Pipeline
The InSARLite workflow consists of an initial Project Configuration step followed by four main processing steps:
Project Configuration (Step 0)
Purpose: Set up the project foundation before processing begins.
Spatial and Temporal Definition
Define study area extent (bounding box or AOI)
Specify date range for Sentinel-1 acquisitions
Select orbit direction (ascending/descending)
Data Management
Query available Sentinel-1 scenes from ASF
Download selected data automatically
Extract downloaded ZIP files
Validate extracted SAFE directories
DEM Setup
Specify path to existing DEM file, or
Automatically download SRTM DEM (30m or 90m resolution)
Output Configuration
Define output folder location
Set project name
Optionally configure GACOS atmospheric correction data
Confirmation
Review all configuration parameters
Click “Confirm Configuration” to finalize setup
Generate complete directory structure
Once configuration is confirmed, the four main processing steps become accessible.
Step 1: Baseline Network Selection (01_Base2Net)
Purpose: Design the interferometric network by selecting master image and defining image pairs.
Baseline Calculation
Compute temporal and perpendicular baselines for all images
Generate baseline_table.dat with centrality ranking
Display baseline plot with time vs perpendicular baseline
Master Selection
Review network centrality rankings
Select optimal master image (typically lowest average baseline)
Confirm master selection
Network Design
Define temporal baseline threshold (e.g., 48 days)
Define perpendicular baseline threshold (e.g., 250 meters)
Generate and visualize interferometric pairs
Optionally edit network (add/remove connections)
Export
Save baseline configuration
Export interferometric network for processing
Key Outputs: baseline_table.dat, intf.in (pair list), baseline plots
Step 2: Alignment and Interferogram Generation (02_Align_Generate)
Purpose: Align images and generate interferograms for all defined pairs.
Parameter Definition
Set range decimation factor
Set azimuth decimation factor
Define filter wavelength
Specify number of processing cores
Processing Steps (automated)
Align secondary images to master reference
Generate interferograms for all pairs
Merge subswaths (if multiple selected)
Calculate mean correlation grid
Calculate correlation standard deviation
Progress Monitoring
Real-time process status updates
Subswath-specific progress indicators
Terminal output for detailed logging
Key Outputs: Aligned images, interferograms, corr_avg.grd, corr_std.grd
Step 3: Phase Unwrapping (03_Unwrap)
Purpose: Unwrap interferogram phase and normalize to reference point.
Phase 1: Mask Definition (Optional)
Define processing mask using:
Mean correlation threshold (e.g., 0.08)
Manual polygon delineation, or
Combination of both approaches
Visualize and export mask
Phase 2: First Unwrapping
Set correlation threshold
Specify number of processing cores
Unwrap all interferograms (respecting mask if defined)
Phase 3: Reference Point Selection
Choose reference point method:
Automated (highest mean correlation, lowest std deviation)
Manual (interactive selection on map)
Select using mean correlation map or validity count map
Normalize all interferograms to reference point
Phase 4: Optional Atmospheric Correction
Apply GACOS corrections (if configured)
Re-normalize interferograms
Key Outputs: Unwrapped interferograms (unwrap.grd), phase files (phase.grd), mask file
Step 4: SBAS Inversion and Visualization (04_SBAS)
Purpose: Perform time-series inversion and visualize deformation results.
SBAS Configuration
Set incidence angle
Define smoothing factor
Select SBAS mode (standard or parallel)
Configure optional outputs (RMS, DEM residual)
Set atmospheric filtering iterations (if desired)
SBAS Processing (automated)
Perform Small Baseline Subset inversion
Generate displacement time series
Calculate mean velocity (VLOS)
Apply optional spatio-temporal filtering
Visualization
Launch Surface Deformation Visualizer
Reproject velocity from radar to geographic coordinates
Generate velocity KML for Google Earth
Display interactive velocity map
Interactive Analysis
Click any location to view time series
Use Polygon Mode for multi-pixel analysis
Export time series plots (PNG format)
Export time series data (CSV format)
Key Outputs: disp_*.grd (time series), vel.grd (mean velocity), KML files, time series plots
Data Flow Summary
Sentinel-1 SLC Data → Orbit Files → Alignment → Interferograms →
Unwrapping → SBAS Inversion → Deformation Time Series → Visualization
            ↑                    ↑                ↑
          DEM Data          Mask & Ref Pt    GACOS Data
For detailed step-by-step instructions with screenshots, see the Turkey Case Study Tutorial.
Key Features
🎯 Interactive Baseline Planning
Real-time baseline network visualization
Click-and-drag pair selection
Automatic master scene selection
Network optimization tools
🛰️ Automated Data Management
Seamless EarthData integration
Bulk data downloads with progress tracking
Automatic file organization
DEM data acquisition and processing
⚙️ Professional Processing
Complete GMTSAR workflow integration
Parallel processing capabilities
Quality control at each step
Flexible parameter configuration
📊 Advanced Visualization
Interactive result viewing
Time series plotting and analysis
Publication-ready figure generation
Animation creation tools
🔧 User-Friendly Interface
Intuitive step-by-step workflow
Progress tracking and logging
Error handling and recovery
Comprehensive help system
Technical Specifications
Supported Data Types
SAR Data: Sentinel-1 (C-band)
DEM Data: SRTM (30m and 90m resolution)
Orbits: Precise and restituted orbits
Atmospheric: GACOS atmospheric corrections
Note
Future DEM Support: ASTER and NASADEM DEM options are planned for future releases.
Output Formats
Raster: NetCDF, GeoTIFF, GMT GRD
Vector: Shapefiles, KML
Images: PNG, PDF, SVG
Data: CSV, HDF5
Performance Characteristics
Processing Speed: Optimized for multi-core systems
Memory Usage: Efficient memory management
Scalability: Handles large datasets and long time series
Reliability: Robust error handling and recovery
Best Practices
Project Planning
Start Small: Begin with limited areas and time periods
Check Data Availability: Verify Sentinel-1 coverage
Consider Baselines: Plan for optimal temporal/spatial baselines
Resource Planning: Ensure adequate storage and computation
Data Quality
Coherence Assessment: Monitor interferometric quality
Baseline Optimization: Use appropriate baseline thresholds
Seasonal Considerations: Account for vegetation and weather
Validation: Cross-check results with independent data
Processing Efficiency
Parallel Processing: Utilize multiple CPU cores
Storage Management: Use fast storage for processing
Memory Optimization: Monitor memory usage
Incremental Processing: Process in manageable chunks
Next Steps
Ready to start using InSARLite? Continue to:
User Interface Guide - Learn the InSARLite interface
Data Management - Set up data downloads
Quick Start Guide - Complete your first project
For technical details, see:
Developer Guide - Architecture and internals